G3-Browser
This is the G3 (GFZ GRACE Gravity) Browser, where you can compare models series, with different filter and correction settings.
You can select the functional which should be used in the calculation for all the models.
You can add models with the "+"-Button and remove added models with the corresponding "-"-Button.
Models may be available with different degrees and with variable filters applied.
You can choose to replace the coefficient of degree 2 and order 0 (C20) with an estimate derived from satelite laser ranging (SLR) observations.
You can choose to correct for the Glacial Isostatic Adjustment (GIA), which subtracts the ICE-6G GIA model. The reference date for this correction is the 1st
of January 2002.
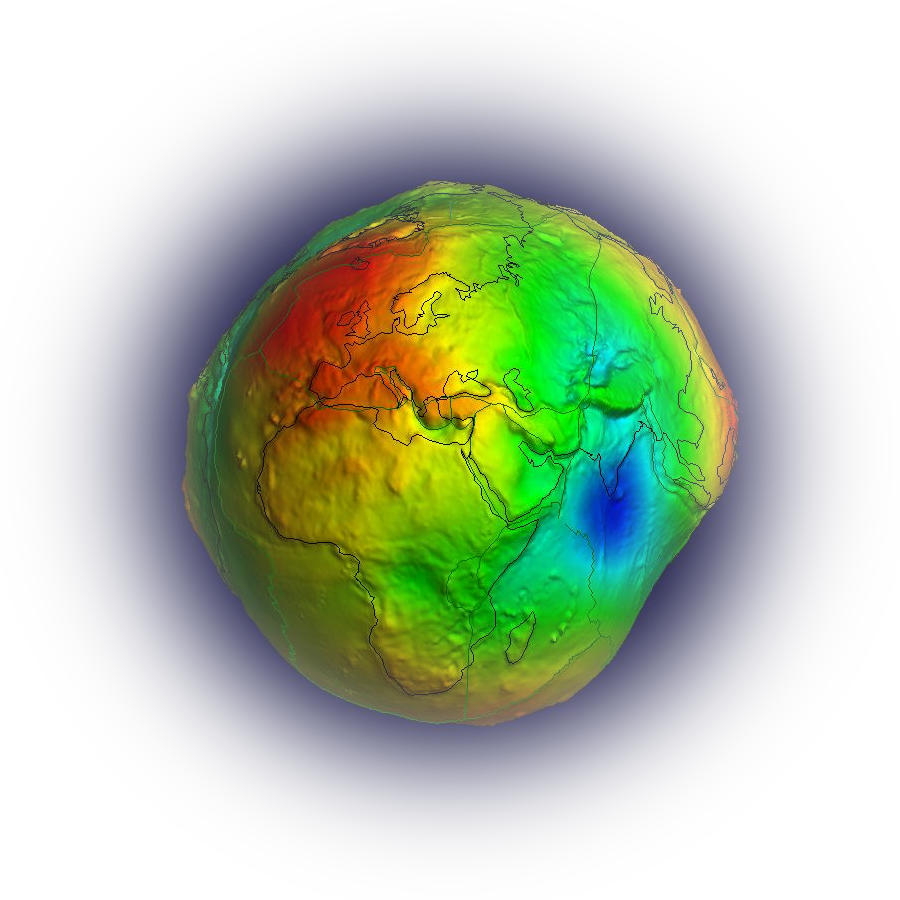
One of the selected models is shown in the map, which one you can select by the drop down menu in the top right corner of the map.
You can zoom in the map either by the slider on the right or using Shift + MouseWheel.
You canc change the intensity of the colors in the map by slider in the bottom left corner.
The graph under the map initially show the global average. By clicking a basin in the map the graph show thes average of the selected basin.
When choosing "Point" instead of a basin set in the top left corner of the map, the graph shows the timeseries for a specified point on the map. (These values
are interpolated from a 1x1 degree grid.)
To select the month which is shown in the map, you can click on the data point in the graph. You can also cycle through all the data points by clicking the
Play-Button in the top left corner of the Graph.
Please keep in mind that this is a prototype and some things may not work as expected yet.