ICGEM Home
Other Celestial Bodies
Table of Models
3D Visualization
Calculation Service
Imprint Data Protection Admin-Login
Gravity Field Models
Static Models Temporal Models Simulated Models Topographic ModelsCalculation Service
Regular grids User-defined points G3-Browser (beta)3D Visualisation
Static Models Temporal Models Trend & Amplitude Spherical HarmonicsEvaluation
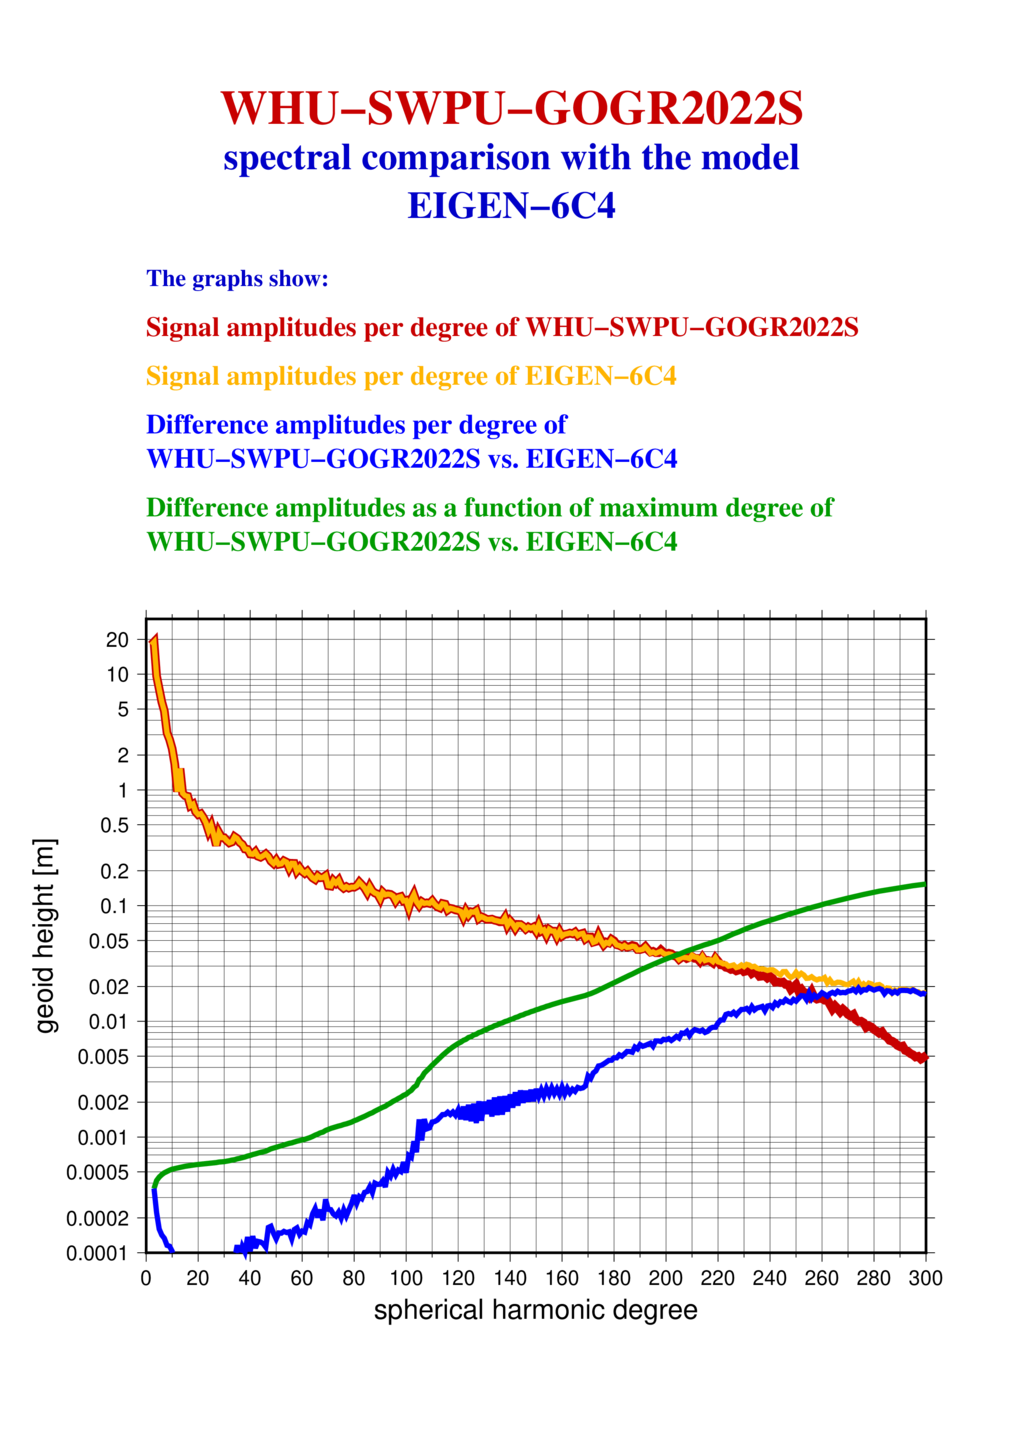
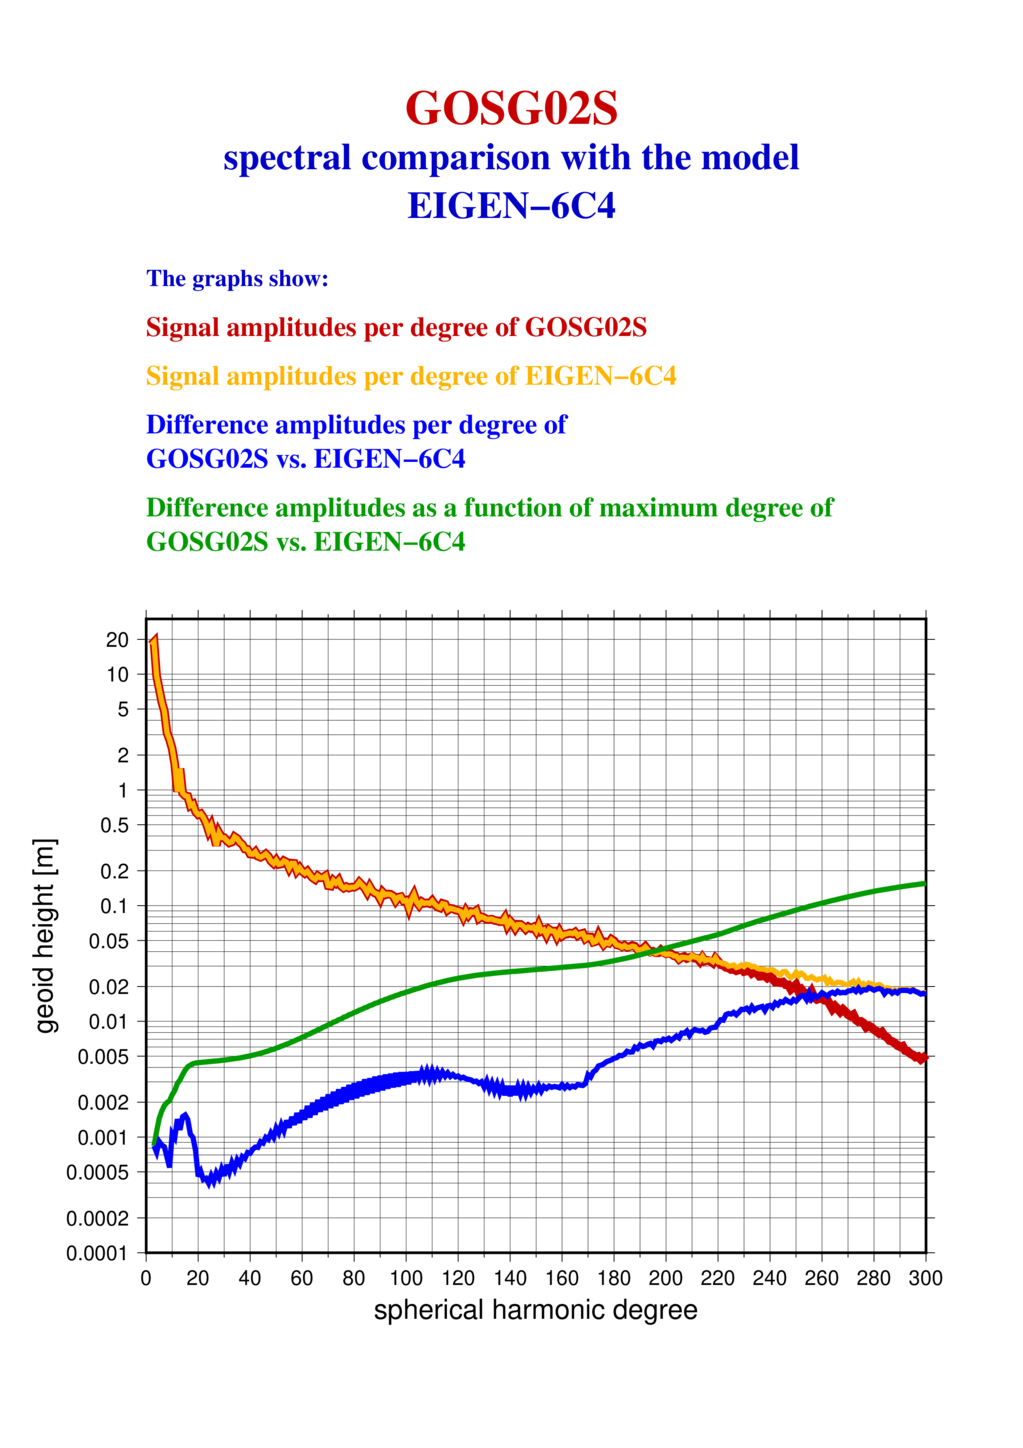
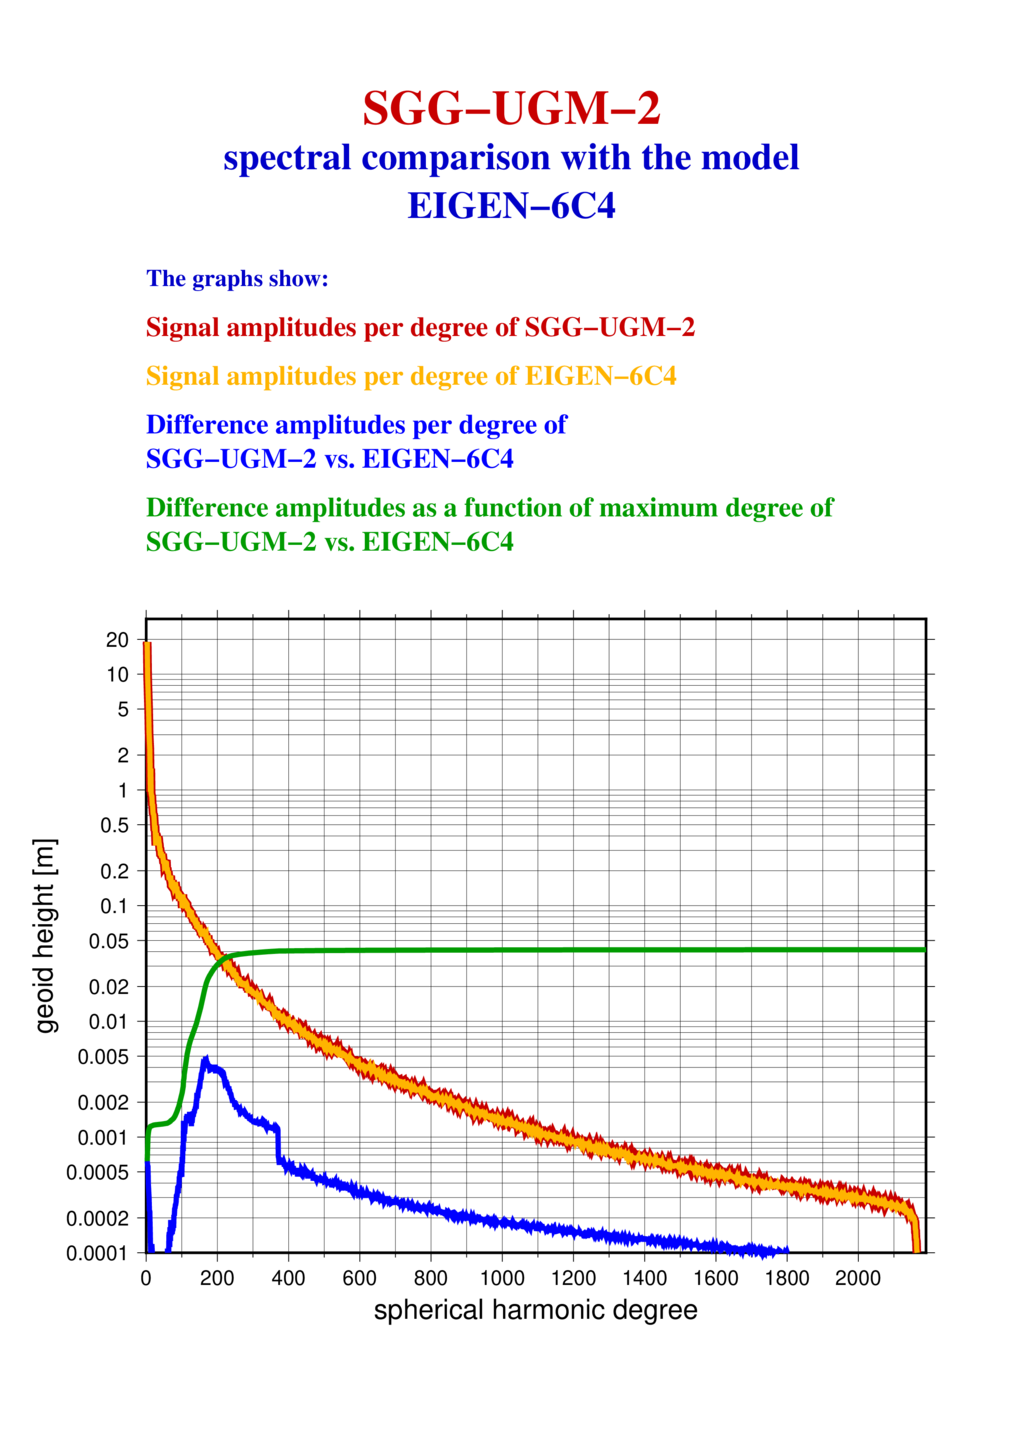
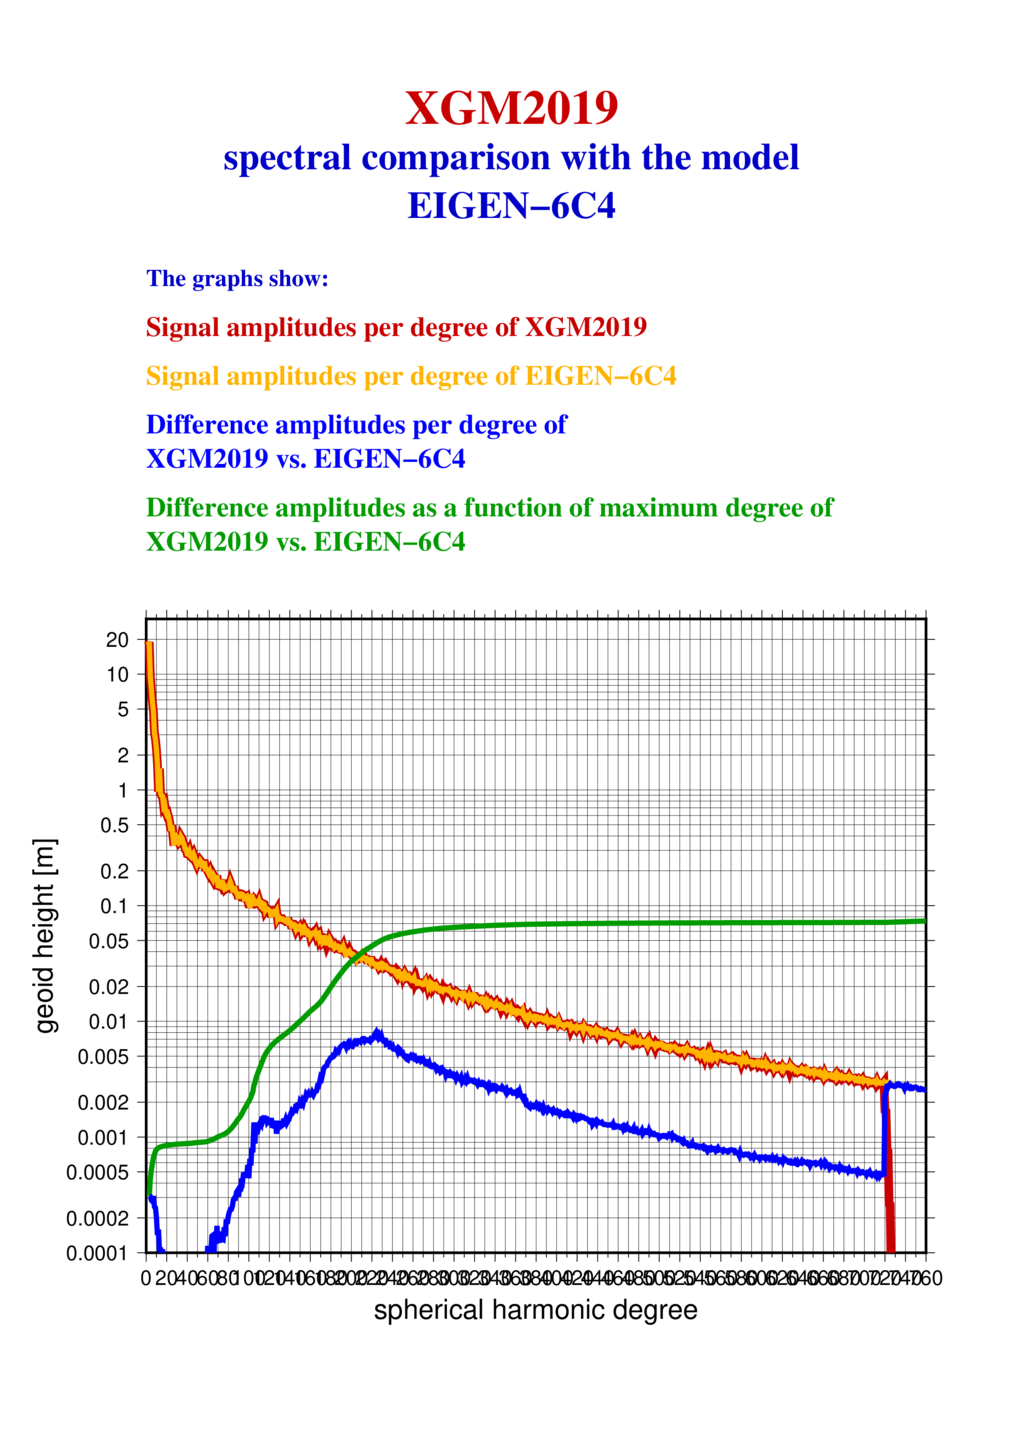
Spectral domain GNSS LevelingDocumentation
FAQ Theory References Latest Changes Discussion ForumOther Celestial Bodies
(Moon,Venus, Mars)
Table of Models
3D Visualization
Calculation Service
Imprint Data Protection Admin-Login


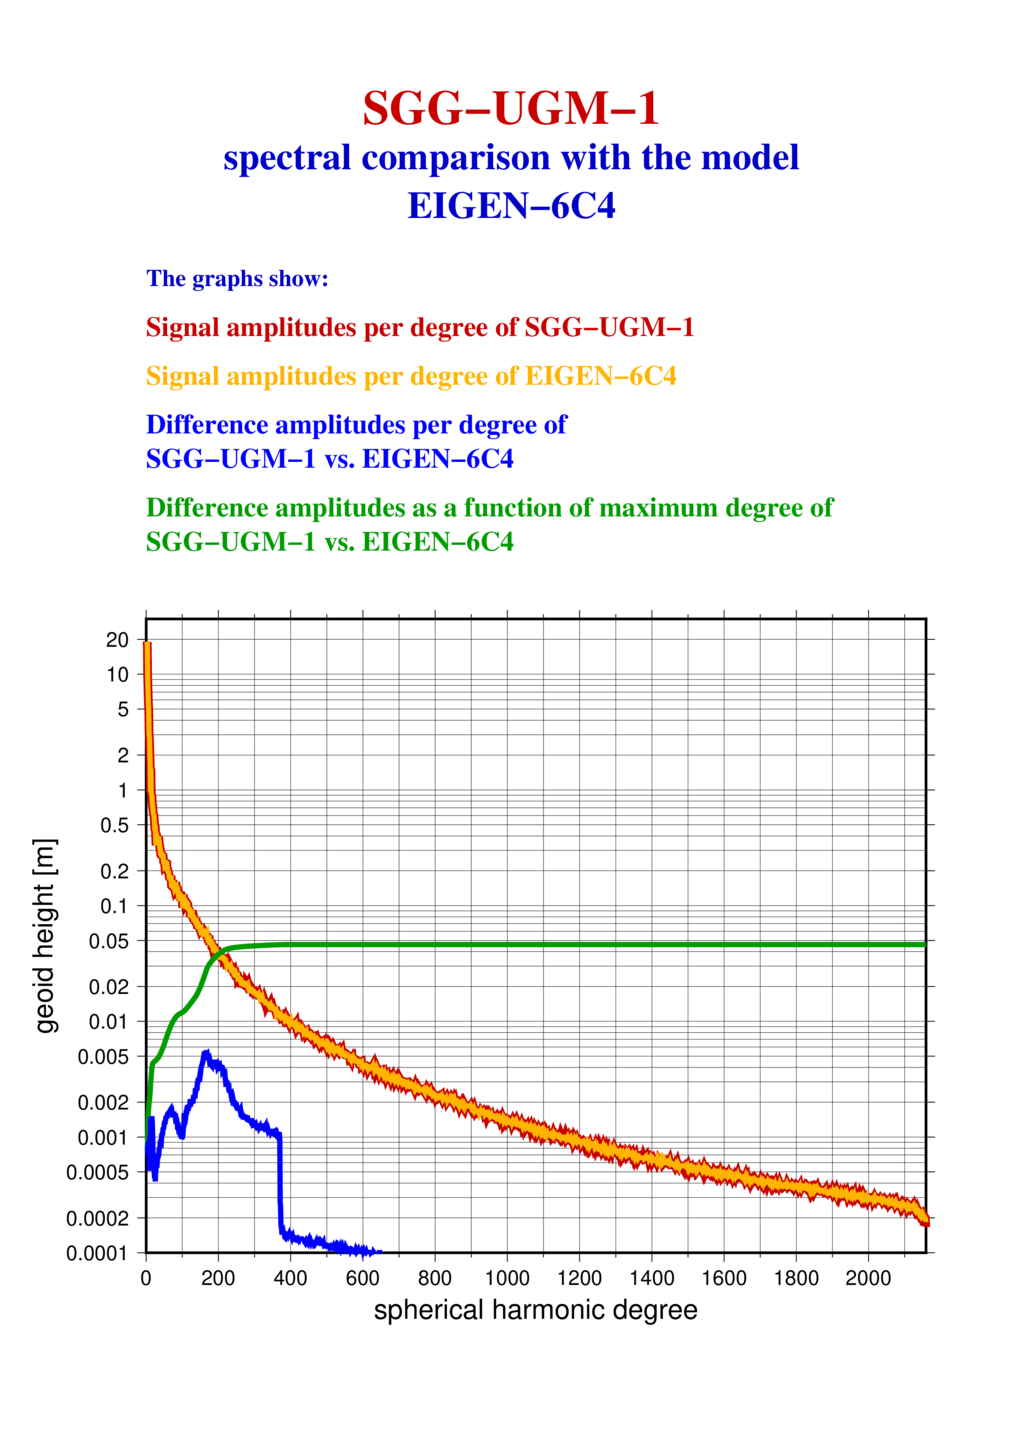

.png)
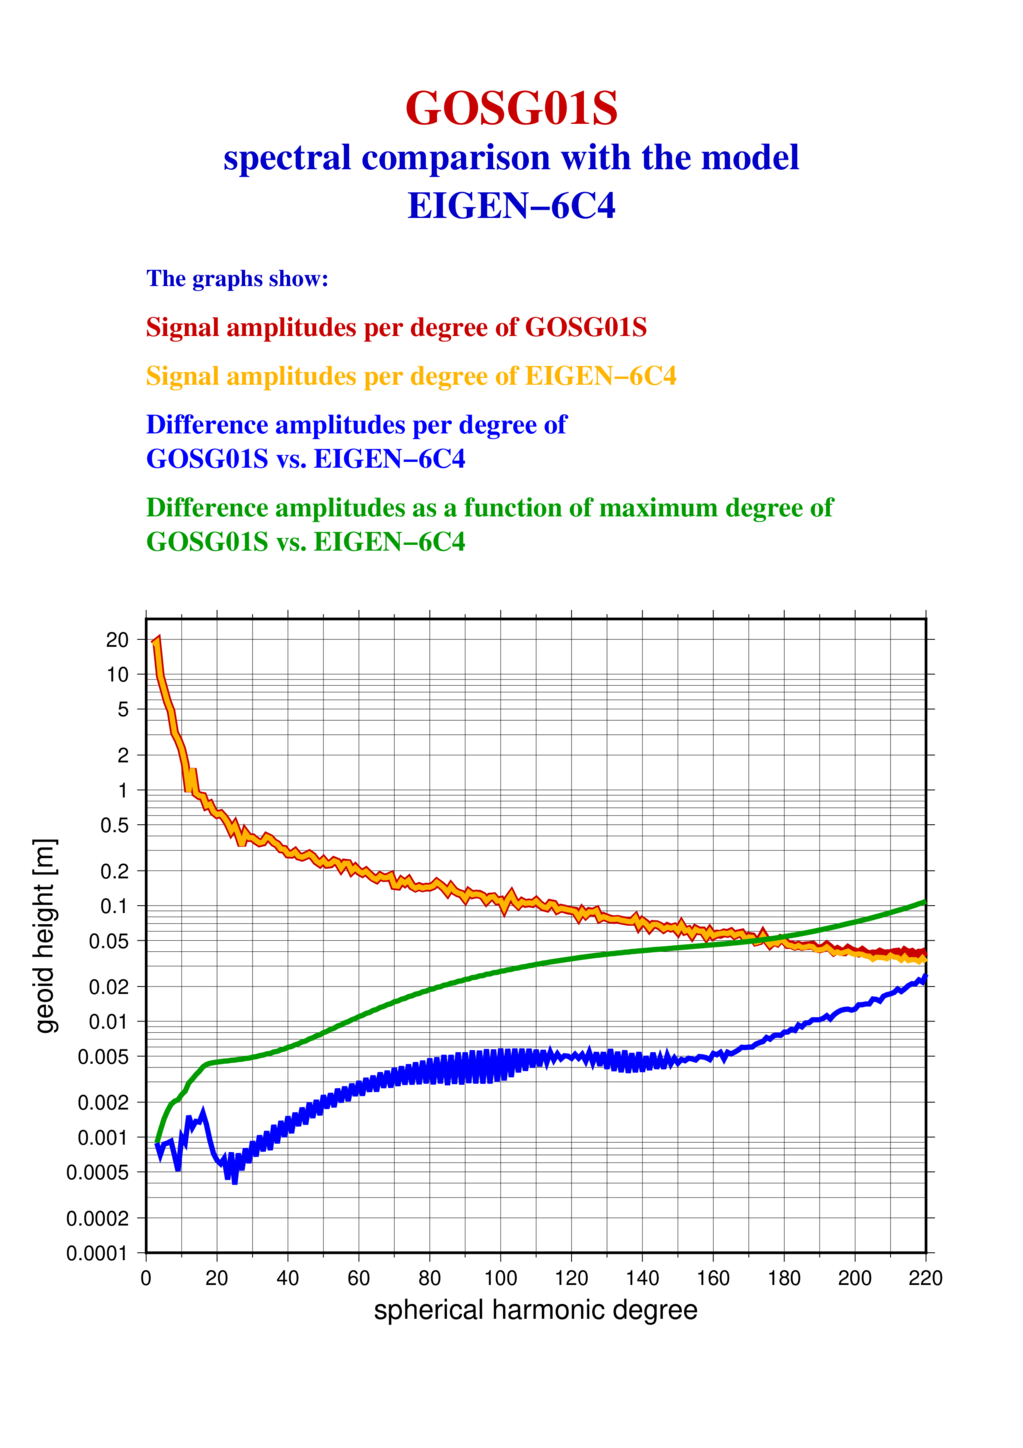
.png)
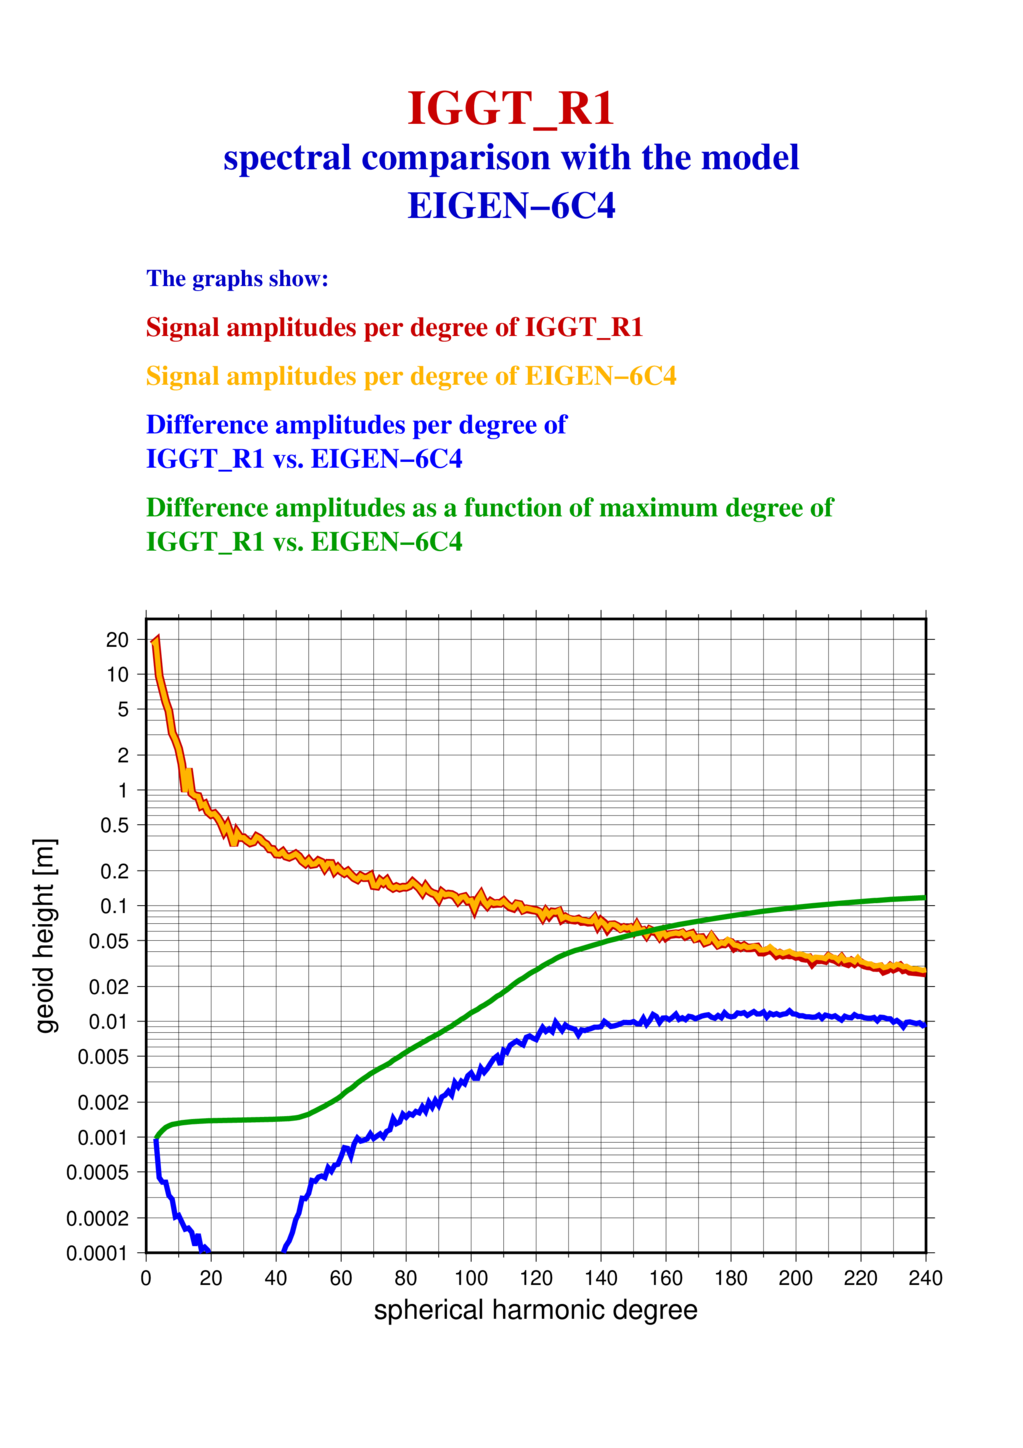
.png)


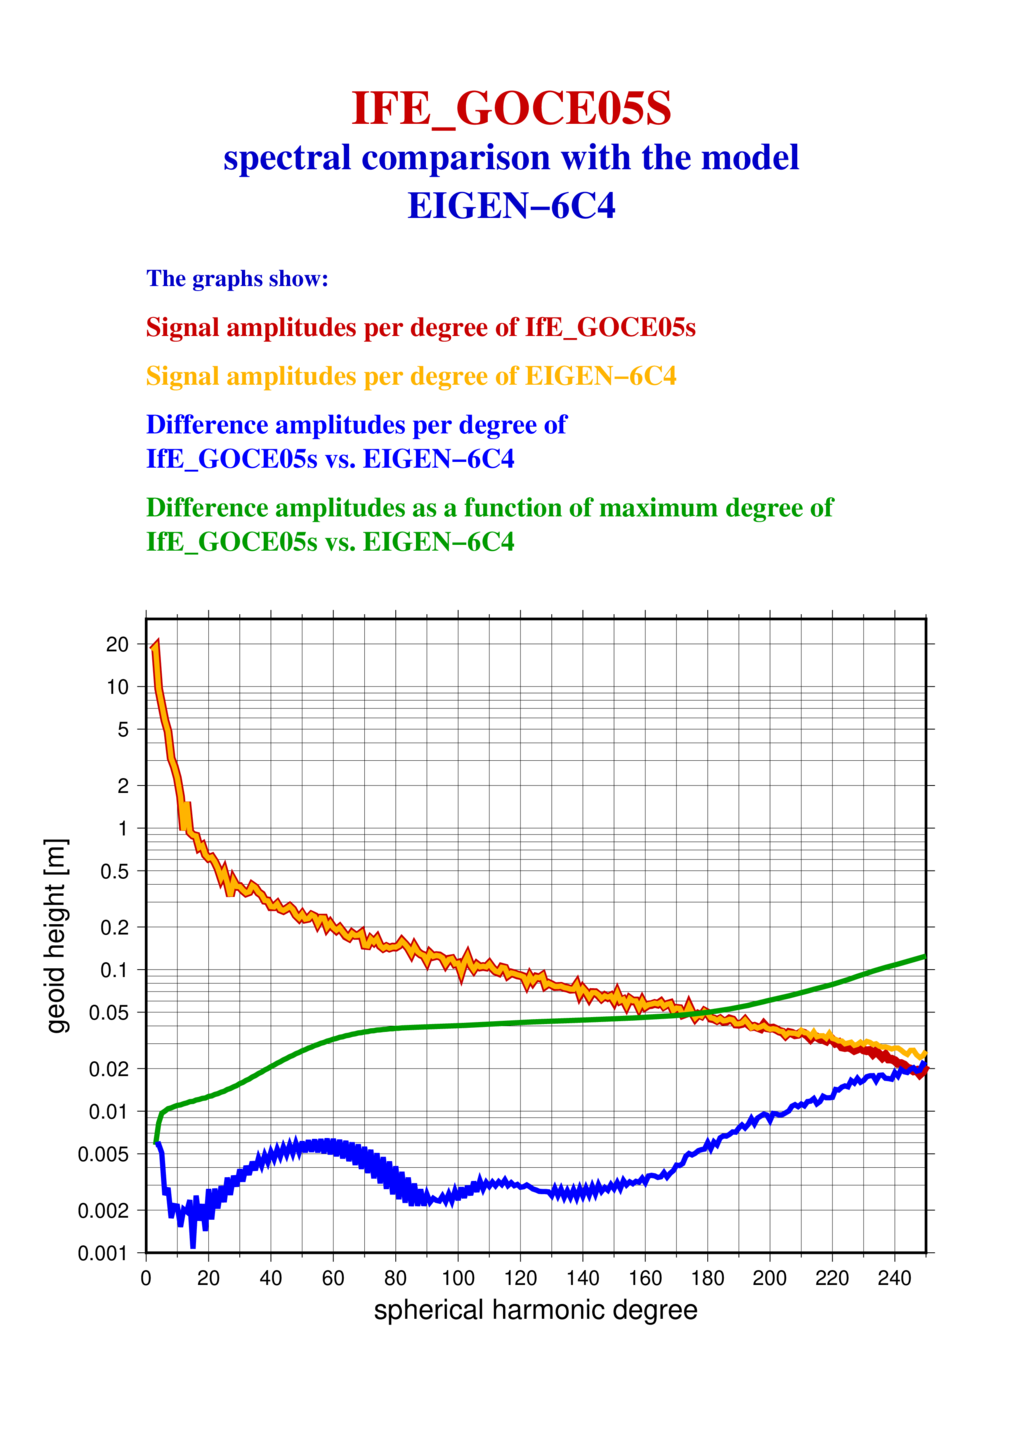
.png)


.png)